Waterway Engineering
.jpg/:/rs=w:1209,h:605,cg:true,m/cr=w:1209,h:605)
SEDIMENTATION & EROSION ANALYSIS
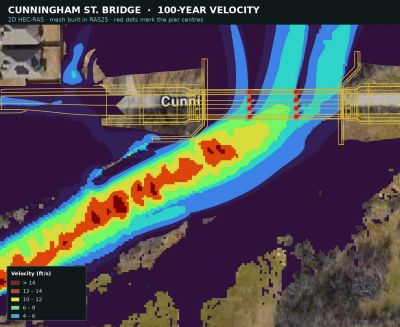
Moving water carries sediment, and where it moves faster than the bed or bank can withstand, it takes material with it — undermining a bridge pier, cutting back an abutment, or stripping a watershed and filling the reservoir downstream. Effective water resource engineering analyzes this process at whatever scale the problem occurs. At a structure, this involves two-dimensional hydraulic modeling to determine the actual velocity and shear stress at the pier or bank rather than relying on a cross-section average. This data is compared against what the in-place material can tolerate, allowing for the proper sizing of erosion control measures such as riprap, gabion, or armoring. At the watershed scale, sedimentation analysis is essential for modeling sediment yield and erosion to identify the sources of material and the most effective interventions to reduce it. In both scenarios, the goal remains the same: to understand where the energy is concentrated before deciding what constructions to implement.
Sedimentation and Erosion Analysis
Cunningham Street Bridge Scour Mitigation
Moving water carries sediment, and where it moves faster than the bed or bank can withstand, it takes material with it — undermining a bridge pier, cutting back an abutment, or stripping a watershed and filling the reservoir downstream. Effective water resource engineering analyzes this process at whatever scale the problem occurs. At a structure, this involves two-dimensional hydraulic modeling to determine the actual velocity and shear stress at the pier or bank rather than relying on a cross-section average. This data is compared against what the in-place material can tolerate, allowing for the proper sizing of erosion control measures such as riprap, gabion, or armoring. At the watershed scale, sedimentation analysis is essential for modeling sediment yield and erosion to identify the sources of material and the most effective interventions to reduce it. In both scenarios, the goal remains the same: to understand where the energy is concentrated before deciding what constructions to implement.